Creating custom metrics
The default information exposed by the expvar handler is a good start, but we can make it even more useful by exposing some additional custom metrics in the JSON response.
To illustrate this, we’ll start really simple and first expose our application version number in the JSON. If you don’t remember, the version number is currently defined as the string constant "1.0.0" in our main.go file.
The code to do this breaks down into two basic steps: first we need to register a custom variable with the expvar package, and then we need to set the value for the variable itself. In one line, the code looks roughly like this:
expvar.NewString("version").Set(version)
The first part of this — expvar.NewString("version") — creates a new expvar.String type, then publishes it so it appears in the expvar handler’s JSON response with the name "version", and then returns a pointer to it. Then we use the Set() method on it to assign an actual value to the pointer.
Two other things to note:
- The
expvar.Stringtype is safe for concurrent use. So — if you want to — it’s OK to manipulate this value at runtime from your application handlers. - If you try to register two
expvarvariables with the same name, you’ll get a runtime panic when the duplicate variable is registered.
Let’s go ahead and integrate this code into our main() function, like so:
package main

import (
    "context"
    "database/sql"
    "expvar" // New import
    "flag"
    "log/slog"
    "os"
    "strings"
    "sync"
    "time"

    "greenlight.alexedwards.net/internal/data"
    "greenlight.alexedwards.net/internal/mailer"

    _ "github.com/lib/pq"
)

// Remember, our version number is just a constant string (for now).
const version = "1.0.0"

...

func main() {
    ...

    // Publish a new "version" variable in the expvar handler containing our application
    // version number (currently the constant "1.0.0").
    expvar.NewString("version").Set(version)

    app := &application{
        config: cfg,
        logger: logger,
        models: data.NewModels(db),
        mailer: mailer,
    }

    err = app.serve()
    if err != nil {
        logger.Error(err.Error())
        os.Exit(1)
    }
}

...
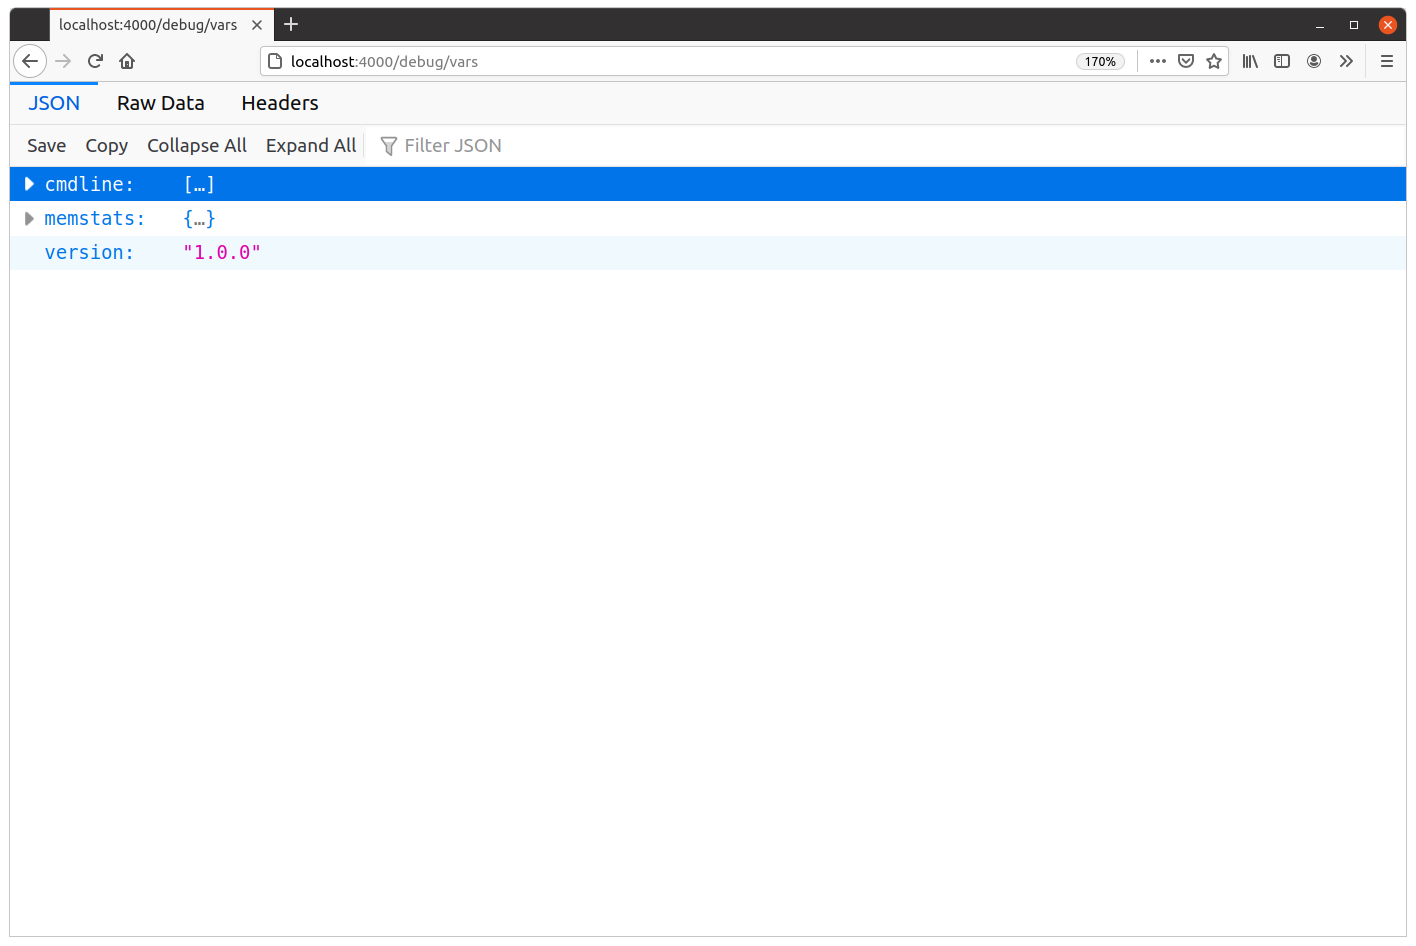
If you restart the API and visit http://localhost:4000/debug/vars in your web browser again, you should now see a "version": "1.0.0" item in the JSON.
Similar to this:
Dynamic metrics
Occasionally you might want to publish metrics which require you to call other code — or do some kind of pre-processing — to generate the necessary information. To help with this there is the expvar.Publish() function, which allows you to publish the result of a function in the JSON output.
For example, if you want to publish the number of currently active goroutines from Go’s runtime.NumGoroutine() function, you could write the following code:
expvar.Publish("goroutines", expvar.Func(func() any {
    return runtime.NumGoroutine()
}))
It’s important to point out here that the any value returned from this function must encode to JSON without any errors. If it can’t be encoded to JSON, then it will be omitted from the expvar output and the response from the GET /debug/vars endpoint will be malformed. Any error will be silently discarded.
In the case of the code snippet above, runtime.NumGoroutine() returns a regular int type — which will encode to a JSON number. So there’s no problem with that here.
OK, let’s add this code to our main() function, along with two other functions which:
- Publish information about the state of our database connection pool (such as the number of idle and in-use connections) via the
db.Stats()method. - Publish the current Unix timestamp with second precision.
package main

import (
    "context"
    "database/sql"
    "expvar"
    "flag"
    "log/slog"
    "os"
    "runtime" // New import
    "strings"
    "sync"
    "time"

    "greenlight.alexedwards.net/internal/data"
    "greenlight.alexedwards.net/internal/mailer"

    _ "github.com/lib/pq"
)

...

func main() {
    ...

    expvar.NewString("version").Set(version)

    // Publish the number of active goroutines.
    expvar.Publish("goroutines", expvar.Func(func() any {
        return runtime.NumGoroutine()
    }))

    // Publish the database connection pool statistics.
    expvar.Publish("database", expvar.Func(func() any {
        return db.Stats()
    }))

    // Publish the current Unix timestamp.
    expvar.Publish("timestamp", expvar.Func(func() any {
        return time.Now().Unix()
    }))

    app := &application{
        config: cfg,
        logger: logger,
        models: data.NewModels(db),
        mailer: mailer,
    }

    err = app.serve()
    if err != nil {
        logger.Error(err.Error())
        os.Exit(1)
    }
}

...
If you restart the API and open the GET /debug/vars endpoint in your browser again, you should now see the additional "database", "goroutines" and "timestamp" items in the JSON. Like so:
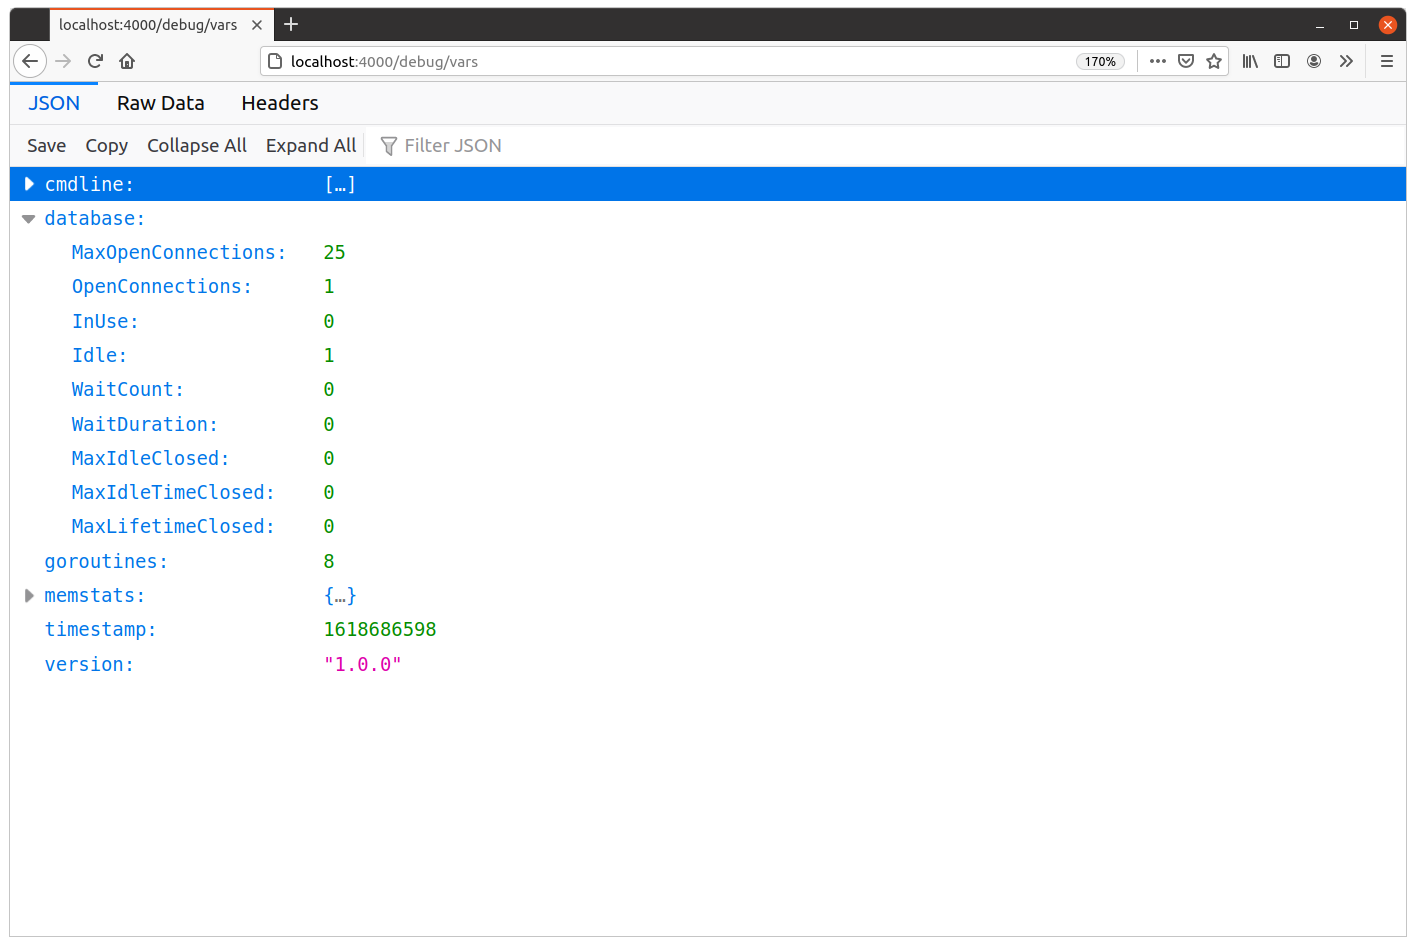
In my case, I can see that the application currently has 8 active goroutines, and the database connection pool is in its ‘initial’ state with just one currently idle connection (which was created when our code called db.PingContext() on startup).
If you like, you can use a tool like hey to generate some requests to your application and see how these figures change under load. For example, you can send a batch of requests to the POST /v1/tokens/authentication endpoint (which is slow and costly because it checks a bcrypt-hashed password) like so:
$ BODY='{"email": "alice@example.com", "password": "pa55word"}'
$ hey -d "$BODY" -m "POST" http://localhost:4000/v1/tokens/authentication

Summary:
  Total:        8.0979 secs
  Slowest:      2.4612 secs
  Fastest:      1.6169 secs
  Average:      1.9936 secs
  Requests/sec: 24.6977

  Total data:   24975 bytes
  Size/request: 124 bytes

Response time histogram:
  1.617 [1]  |■
  1.701 [6]  |■■■■■
  1.786 [10] |■■■■■■■■■
  1.870 [26] |■■■■■■■■■■■■■■■■■■■■■■■
  1.955 [36] |■■■■■■■■■■■■■■■■■■■■■■■■■■■■■■■
  2.039 [46] |■■■■■■■■■■■■■■■■■■■■■■■■■■■■■■■■■■■■■■■■
  2.123 [36] |■■■■■■■■■■■■■■■■■■■■■■■■■■■■■■■
  2.208 [21] |■■■■■■■■■■■■■■■■■■
  2.292 [12] |■■■■■■■■■■
  2.377 [4]  |■■■
  2.461 [2]  |■■


Latency distribution:
  10% in 1.8143 secs
  25% in 1.8871 secs
  50% in 1.9867 secs
  75% in 2.1000 secs
  90% in 2.2017 secs
  95% in 2.2642 secs
  99% in 2.3799 secs

Details (average, fastest, slowest):
  DNS+dialup:	0.0009 secs, 1.6169 secs, 2.4612 secs
  DNS-lookup:	0.0005 secs, 0.0000 secs, 0.0030 secs
  req write:	0.0002 secs, 0.0000 secs, 0.0051 secs
  resp wait:	1.9924 secs, 1.6168 secs, 2.4583 secs
  resp read:	0.0000 secs, 0.0000 secs, 0.0001 secs

Status code distribution:
  [201]	200 responses
If you visit the GET /debug/vars endpoint while the hey tool is running, you should see that your application metrics now look quite different:
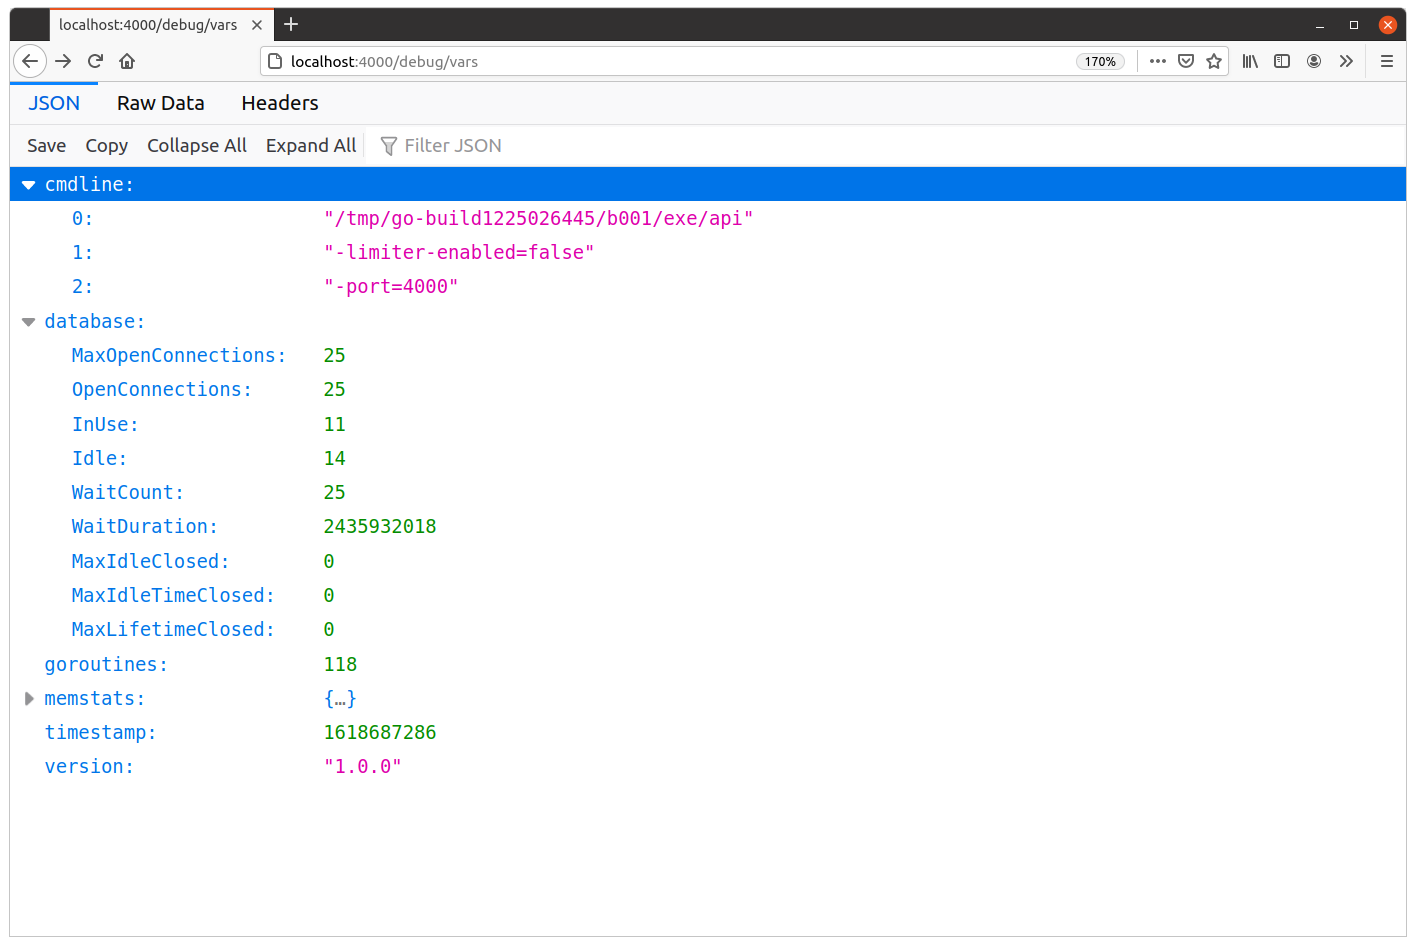
At the moment I took this screenshot, we can see that my API application had 118 active goroutines, with 11 database connections in use and 14 connections sitting idle.
There are a couple of other interesting things to point out too.
The database WaitCount figure of 25 is the total number of times that our application had to wait for a database connection to become available in our sql.DB pool (because all connections were in-use). Likewise, WaitCountDuration is the cumulative amount of time (in nanoseconds) spent waiting for a connection. From these, it’s possible to calculate that when our application did have to wait for a database connection, the average wait time was approximately 98 milliseconds. Ideally, you want to be seeing zeroes or very low numbers for these two things under normal load in production.
Also, the MaxIdleTimeClosed figure is the total count of the number of connections that have been closed because they reached their ConnMaxIdleTime limit (which in our case is set to 15 minutes by default). If you leave the application running but don’t use it, and come back in 15 minutes time, you should see that the number of open connections has dropped to zero and the MaxIdleTimeClosed count has increased accordingly.
You might like to play around with this and try changing some of the configuration parameters for the connection pool to see how it affects the behavior of these figures under load. For example:
$ go run ./cmd/api -limiter-enabled=false -db-max-open-conns=50 -db-max-idle-conns=50 -db-max-idle-time=20s -port=4000
Additional information
Protecting the metrics endpoint
It’s important to be aware that these metrics provide very useful information to anyone who wants to perform a denial-of-service attack against your application, and that the "cmdline" values may also expose potentially sensitive information (like a database DSN).
So you should make sure to restrict access to the GET /debug/vars endpoint when running in a production environment.
There are a few different approaches you could take to do this.
One option is to leverage our existing authentication process and create a metrics:view permission so that only certain trusted users can access the endpoint. Another option would be to use HTTP Basic Authentication to restrict access to the endpoint.
In our case, when we deploy our application in production later we will run it behind Caddy as a reverse proxy. As part of our Caddy set up, we’ll restrict access to the GET /debug/vars endpoint so that it can only be accessed via connections from the local machine, rather than being exposed on the internet.
Removing default metrics
It’s currently not possible to remove the default "cmdline" and "memstats" items from the expvar handler, even if you want to. There’s an open issue regarding this, and hopefully it will become possible to omit these in a future version of Go.