Request-level metrics
In this chapter we’re going to create some new middleware to record custom request-level metrics for our application. We’ll start by recording the following three things:
- The total number of requests received.
- The total number of responses sent.
- The total (cumulative) time taken to process all requests in microseconds.
All these values will be integers, so we’ll be able to register these metrics with the expvar package using the expvar.NewInt() function.
Let’s jump straight into the code and create a new metrics() middleware method, which initializes the necessary expvar variables and then updates them each time we process a request. Like so:
package main

import (
    "errors"
    "expvar" // New import
    "fmt"
    "net"
    "net/http"
    "strings"
    "sync"
    "time"

    "greenlight.alexedwards.net/internal/data"
    "greenlight.alexedwards.net/internal/validator"

    "golang.org/x/time/rate"
)

...

func (app *application) metrics(next http.Handler) http.Handler {
    // Initialize the new expvar variables when the middleware chain is first built.
    var (
        totalRequestsReceived           = expvar.NewInt("total_requests_received")
        totalResponsesSent              = expvar.NewInt("total_responses_sent")
        totalProcessingTimeMicroseconds = expvar.NewInt("total_processing_time_μs")
    )

    // The following code will be run for every request...
    return http.HandlerFunc(func(w http.ResponseWriter, r *http.Request) {
        // Record the time that we started to process the request.
        start := time.Now()

        // Use the Add() method to increment the number of requests received by 1.
        totalRequestsReceived.Add(1)

        // Call the next handler in the chain.
        next.ServeHTTP(w, r)

        // On the way back up the middleware chain, increment the number of responses
        // sent by 1.
        totalResponsesSent.Add(1)

        // Calculate the number of microseconds since we began to process the request,
        // then increment the total processing time by this amount.
        duration := time.Since(start).Microseconds()
        totalProcessingTimeMicroseconds.Add(duration)
    })
}
Once that’s done, we need to update the cmd/api/routes.go file to include the new metrics() middleware, right at the beginning of the chain. Like so:
package main

...

func (app *application) routes() http.Handler {
    router := httprouter.New()

    router.NotFound = http.HandlerFunc(app.notFoundResponse)
    router.MethodNotAllowed = http.HandlerFunc(app.methodNotAllowedResponse)

    router.HandlerFunc(http.MethodGet, "/v1/healthcheck", app.healthcheckHandler)

    router.HandlerFunc(http.MethodGet, "/v1/movies", app.requirePermission("movies:read", app.listMoviesHandler))
    router.HandlerFunc(http.MethodPost, "/v1/movies", app.requirePermission("movies:write", app.createMovieHandler))
    router.HandlerFunc(http.MethodGet, "/v1/movies/:id", app.requirePermission("movies:read", app.showMovieHandler))
    router.HandlerFunc(http.MethodPatch, "/v1/movies/:id", app.requirePermission("movies:write", app.updateMovieHandler))
    router.HandlerFunc(http.MethodDelete, "/v1/movies/:id", app.requirePermission("movies:write", app.deleteMovieHandler))

    router.HandlerFunc(http.MethodPost, "/v1/users", app.registerUserHandler)
    router.HandlerFunc(http.MethodPut, "/v1/users/activated", app.activateUserHandler)

    router.HandlerFunc(http.MethodPost, "/v1/tokens/authentication", app.createAuthenticationTokenHandler)

    router.Handler(http.MethodGet, "/debug/vars", expvar.Handler())

    // Use the new metrics() middleware at the start of the chain.
    return app.metrics(app.recoverPanic(app.enableCORS(app.rateLimit(app.authenticate(router)))))
}
OK, let’s try this out. Go ahead and run the API with rate limiting disabled again:
$ go run ./cmd/api -limiter-enabled=false
time=2023-09-10T10:59:13.722+02:00 level=INFO msg="database connection pool established"
time=2023-09-10T10:59:13.722+02:00 level=INFO msg="starting server" addr=:4000 env=development
And when you visit localhost:4000/debug/vars in your browser, you should now see that the JSON response includes items for total_requests_received, total_responses_sent and total_processing_time_μs. Like so:

At this point, we can see that our API has received one request and sent zero responses. That makes sense if you think about it — at the moment that this JSON response was generated, it hadn’t actually been sent.
If you refresh the page, you should see these numbers increment — including an increase in the total_processing_time_μs value:

Let’s try this out under load and use hey to make some requests to the POST /v1/tokens/authentication endpoint again.
First restart the API:
$ go run ./cmd/api -limiter-enabled=false
time=2023-09-10T10:59:13.722+02:00 level=INFO msg="database connection pool established"
time=2023-09-10T10:59:13.722+02:00 level=INFO msg="starting server" addr=:4000 env=development
And then use hey to generate the load like so:
$ BODY='{"email": "alice@example.com", "password": "pa55word"}'
$ hey -d "$BODY" -m "POST" http://localhost:4000/v1/tokens/authentication

Summary:
  Total:        9.9141 secs
  Slowest:      3.0333 secs
  Fastest:      1.6788 secs
  Average:      2.4302 secs
  Requests/sec: 20.1732

  Total data:   24987 bytes
  Size/request: 124 bytes

Response time histogram:
  1.679 [1]  |■
  1.814 [1]  |■
  1.950 [3]  |■■■
  2.085 [8]  |■■■■■■■
  2.221 [28] |■■■■■■■■■■■■■■■■■■■■■■■■
  2.356 [39] |■■■■■■■■■■■■■■■■■■■■■■■■■■■■■■■■■■
  2.491 [46] |■■■■■■■■■■■■■■■■■■■■■■■■■■■■■■■■■■■■■■■■
  2.627 [34] |■■■■■■■■■■■■■■■■■■■■■■■■■■■■■■
  2.762 [20] |■■■■■■■■■■■■■■■■■
  2.898 [9]  |■■■■■■■■
  3.033 [11] |■■■■■■■■■■


Latency distribution:
  10% in 2.1386 secs
  25% in 2.2678 secs
  50% in 2.4197 secs
  75% in 2.5769 secs
  90% in 2.7718 secs
  95% in 2.9125 secs
  99% in 3.0220 secs

Details (average, fastest, slowest):
  DNS+dialup: 0.0007 secs, 1.6788 secs, 3.0333 secs
  DNS-lookup: 0.0005 secs, 0.0000 secs, 0.0047 secs
  req write:  0.0001 secs, 0.0000 secs, 0.0012 secs
  resp wait:  2.4293 secs, 1.6787 secs, 3.0293 secs
  resp read:  0.0000 secs, 0.0000 secs, 0.0001 secs

Status code distribution:
  [201]	200 responses
Once that has completed, if you refresh localhost:4000/debug/vars in your browser your metrics should now look something like this:
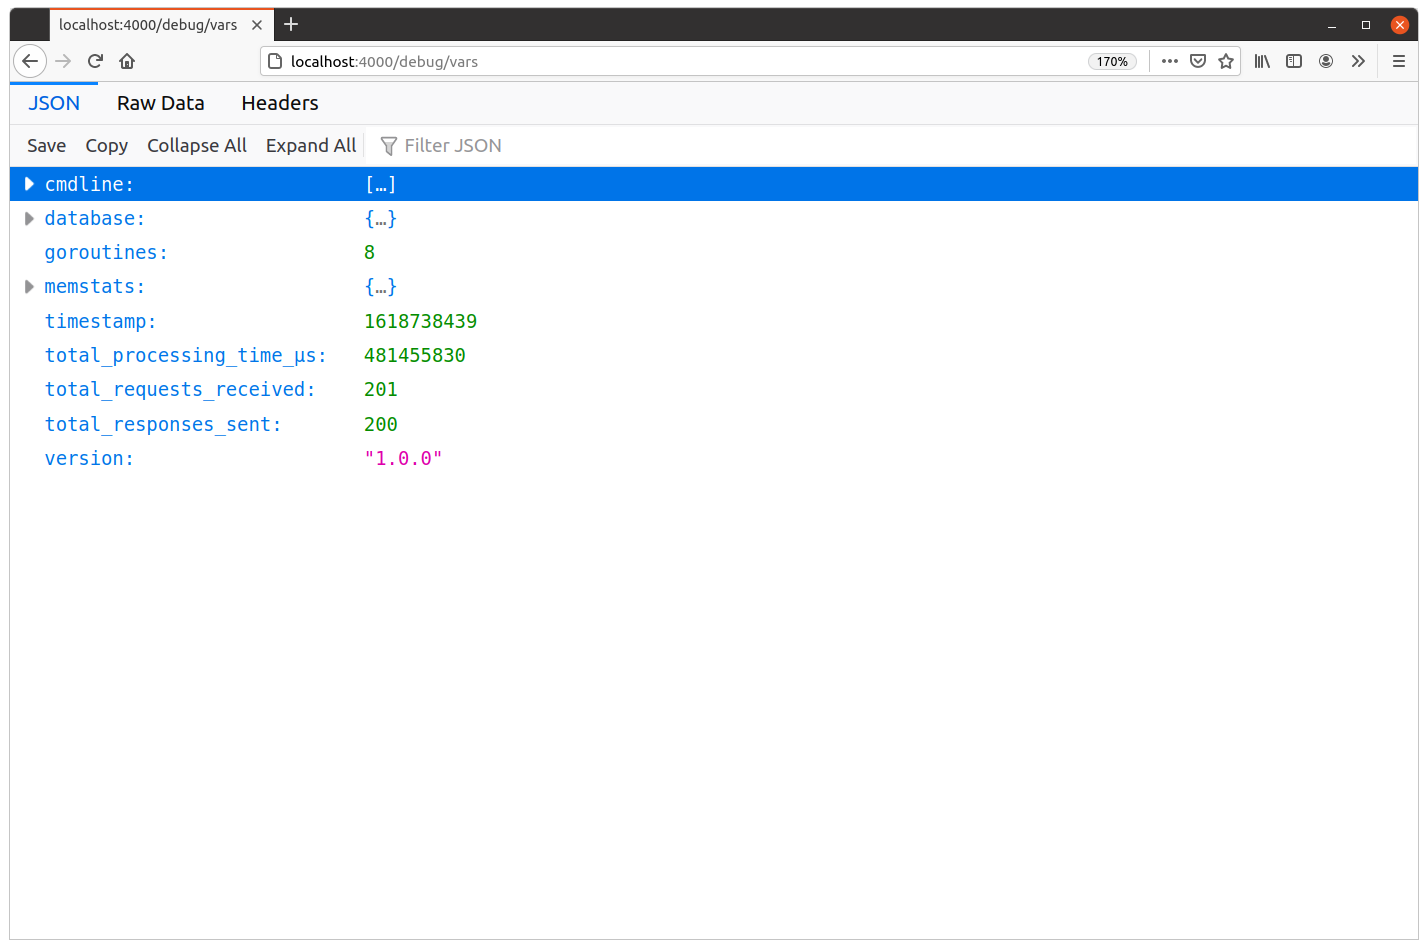
Based on the total_processing_time_μs and total_responses_sent values, we can calculate that the average processing time per request was approximately 2.4 seconds (remember, this endpoint is deliberately slow and computationally expensive since we need to verify the bcrypted user password).
481455830 μs / 201 reqs = 2395303 μs/req = 2.4 s/req
This aligns with the data that we see in the results summary from hey, which gives the average response time as 2.4302 secs. The hey figure is the time for the complete round-trip, so it will always be a little higher as it includes network latency and the time taken for http.Server to manage the request.
Additional information
Calculating additional metrics
Based on the information in the GET /debug/vars response, you can also derive some additional interesting metrics. Such as…
The number of ‘active’ in-flight requests:
total_requests_received - total_responses_sent
The average number of requests received per second (between calls A and B to the
GET /debug/varsendpoint):(total_requests_received_B - total_requests_received_A) / (timestamp_B - timestamp_A)
The average processing time per request (between calls A and B to the
GET /debug/varsendpoint):(total_processing_time_μs_B - total_processing_time_μs_A) / (total_requests_received_B - total_requests_received_A)