Recording HTTP status codes
As well as recording the total count of responses sent, we can take this further and extend our metrics() middleware to start tallying exactly which HTTP status codes our responses had.
The tricky part of doing this is finding out what HTTP status code a response has in our metrics() middleware. Unfortunately Go doesn’t support this out-of-the-box — there is no built-in way to examine an http.ResponseWriter to see what status code is going to be sent to a client.
To capture the response status code, we’ll instead need to create our own custom http.ResponseWriter that records a copy of the HTTP status code for future access.
Before Go 1.20 was released, doing this was brittle and awkward to get right. But now Go has the http.ResponseController type with support for http.ResponseWriter unwrapping, it’s much more straightforward to implement yourself.
Effectively, we want to create a struct that wraps an existing http.ResponseWriter and has custom Write() and WriteHeader() methods implemented on it which record the response status code. Importantly, we should also implement an Unwrap() method on it, which returns the original, wrapped, http.ResponseWriter value.
The code we want to write looks like this:
// The metricsResponseWriter type wraps an existing http.ResponseWriter and also
// contains a field for recording the response status code, and a boolean flag to
// indicate whether the response headers have already been written.
type metricsResponseWriter struct {
    wrapped       http.ResponseWriter
    statusCode    int
    headerWritten bool
}

// This function returns a new metricsResponseWriter instance which wraps a given
// http.ResponseWriter and has a status code of 200 (which is the status
// code that Go will send in an HTTP response by default).
func newMetricsResponseWriter(w http.ResponseWriter) *metricsResponseWriter {
    return &metricsResponseWriter{
        wrapped:    w,
        statusCode: http.StatusOK,
    }
}

// The Header() method is a simple 'pass through' to the Header() method of the
// wrapped http.ResponseWriter.
func (mw *metricsResponseWriter) Header() http.Header {
    return mw.wrapped.Header()
}

// Again, the WriteHeader() method does a 'pass through' to the WriteHeader()
// method of the wrapped http.ResponseWriter. But after this returns,
// we also record the response status code (if it hasn't already been recorded)
// and set the headerWritten field to true to indicate that the HTTP response
// headers have now been written.
func (mw *metricsResponseWriter) WriteHeader(statusCode int) {
    mw.wrapped.WriteHeader(statusCode)

    if !mw.headerWritten {
        mw.statusCode = statusCode
        mw.headerWritten = true
    }
}

// Likewise the Write() method does a 'pass through' to the Write() method of the
// wrapped http.ResponseWriter. Calling this will automatically write any
// response headers, so we set the headerWritten field to true.
func (mw *metricsResponseWriter) Write(b []byte) (int, error) {
    mw.headerWritten = true
    return mw.wrapped.Write(b)
}

// We also need an Unwrap() method which returns the existing wrapped
// http.ResponseWriter.
func (mw *metricsResponseWriter) Unwrap() http.ResponseWriter {
    return mw.wrapped
}
The important thing to note is that our metricsResponseWriter type satisfies the http.ResponseWriter interface. It has Header(), WriteHeader() and Write() methods with the appropriate signature, so we can use it in our handlers just like normal.
Also, notice that we don’t record the status code until after the ‘pass through’ call in the WriteHeader() method. This is because a panic in that operation (potentially due to an invalid status code) may mean that a different status code is ultimately sent to the client.
Lastly, we also set a default status code of 200 OK in the newMetricsResponseWriter() function. It’s important that we set this default here, in case a handler doesn’t ever call Write() or WriteHeader().
But ultimately, our metricsResponseWriter is really just a light layer over the top of an existing http.ResponseWriter value.
Let’s move on, and adapt our metrics() middleware to use this. We’ll also need to publish a new total_responses_sent_by_status variable using the expvar.NewMap() function. This will give us a map in which we can store the different HTTP status codes, along with a running count of responses for each status.
Go ahead and update the cmd/api/middleware.go file as follows:
package main

import (
    "errors"
    "expvar"
    "fmt"
    "net"
    "net/http"
    "strconv" // New import
    "strings"
    "sync"
    "time"

    "greenlight.alexedwards.net/internal/data"
    "greenlight.alexedwards.net/internal/validator"

    "golang.org/x/time/rate"
)

...

type metricsResponseWriter struct {
    wrapped       http.ResponseWriter
    statusCode    int
    headerWritten bool
}

func newMetricsResponseWriter(w http.ResponseWriter) *metricsResponseWriter {
    return &metricsResponseWriter{
        wrapped:    w,
        statusCode: http.StatusOK,
    }
}

func (mw *metricsResponseWriter) Header() http.Header {
    return mw.wrapped.Header()
}

func (mw *metricsResponseWriter) WriteHeader(statusCode int) {
    mw.wrapped.WriteHeader(statusCode)

    if !mw.headerWritten {
        mw.statusCode = statusCode
        mw.headerWritten = true
    }
}

func (mw *metricsResponseWriter) Write(b []byte) (int, error) {
    mw.headerWritten = true
    return mw.wrapped.Write(b)
}

func (mw *metricsResponseWriter) Unwrap() http.ResponseWriter {
    return mw.wrapped
}

func (app *application) metrics(next http.Handler) http.Handler {
    var (
        totalRequestsReceived           = expvar.NewInt("total_requests_received")
        totalResponsesSent              = expvar.NewInt("total_responses_sent")
        totalProcessingTimeMicroseconds = expvar.NewInt("total_processing_time_μs")

        // Declare a new expvar map to hold the count of responses for each HTTP status
        // code.
        totalResponsesSentByStatus = expvar.NewMap("total_responses_sent_by_status")
    )

    return http.HandlerFunc(func(w http.ResponseWriter, r *http.Request) {
        start := time.Now()

        totalRequestsReceived.Add(1)

        // Create a new metricsResponseWriter, which wraps the original
        // http.ResponseWriter value that the metrics middleware received.
        mw := newMetricsResponseWriter(w)

        // Call the next handler in the chain using the new metricsResponseWriter
        // as the http.ResponseWriter value.
        next.ServeHTTP(mw, r)

        totalResponsesSent.Add(1)

        // At this point, the response status code should be stored in the
        // mw.statusCode field. Note that the expvar map is string-keyed, so we
        // need to use the strconv.Itoa() function to convert the status code
        // (which is an integer) to a string. Then we use the Add() method on
        // our new totalResponsesSentByStatus map to increment the count for the
        // given status code by 1.
        totalResponsesSentByStatus.Add(strconv.Itoa(mw.statusCode), 1)

        duration := time.Since(start).Microseconds()
        totalProcessingTimeMicroseconds.Add(duration)
    })
}
Alright, let’s try this out. Run the API again, but this time leave the rate limiter enabled. Like so:
$ go run ./cmd/api
time=2023-09-10T10:59:13.722+02:00 level=INFO msg="database connection pool established"
time=2023-09-10T10:59:13.722+02:00 level=INFO msg="starting server" addr=:4000 env=development
Then use hey again to generate some load against the POST /v1/tokens/authentication endpoint. This should result in a small number of successful 201 Created responses, but many more 429 Too Many Requests responses due to the rate limit being hit.
$ BODY='{"email": "alice@example.com", "password": "pa55word"}'
$ hey -d "$BODY" -m "POST" http://localhost:4000/v1/tokens/authentication

Summary:
  Total:        0.3351 secs
  Slowest:      0.3334 secs
  Fastest:      0.0001 secs
  Average:      0.0089 secs
  Requests/sec: 596.9162

  Total data: 7556 bytes
  Size/request: 37 bytes

Response time histogram:
  0.000 [1]   |
  0.033 [195] |■■■■■■■■■■■■■■■■■■■■■■■■■■■■■■■■■■■■■■■■
  0.067 [0]   |
  0.100 [0]   |
  0.133 [0]   |
  0.167 [0]   |
  0.200 [0]   |
  0.233 [0]   |
  0.267 [0]   |
  0.300 [0]   |
  0.333 [4]   |■


Latency distribution:
  10% in 0.0002 secs
  25% in 0.0002 secs
  50% in 0.0014 secs
  75% in 0.0047 secs
  90% in 0.0075 secs
  95% in 0.0088 secs
  99% in 0.3311 secs

Details (average, fastest, slowest):
  DNS+dialup: 0.0008 secs, 0.0001 secs, 0.3334 secs
  DNS-lookup: 0.0006 secs, 0.0000 secs, 0.0041 secs
  req write:  0.0002 secs, 0.0000 secs, 0.0033 secs
  resp wait:  0.0078 secs, 0.0001 secs, 0.3291 secs
  resp read:  0.0000 secs, 0.0000 secs, 0.0015 secs

Status code distribution:
  [201] 4 responses
  [429] 196 responses
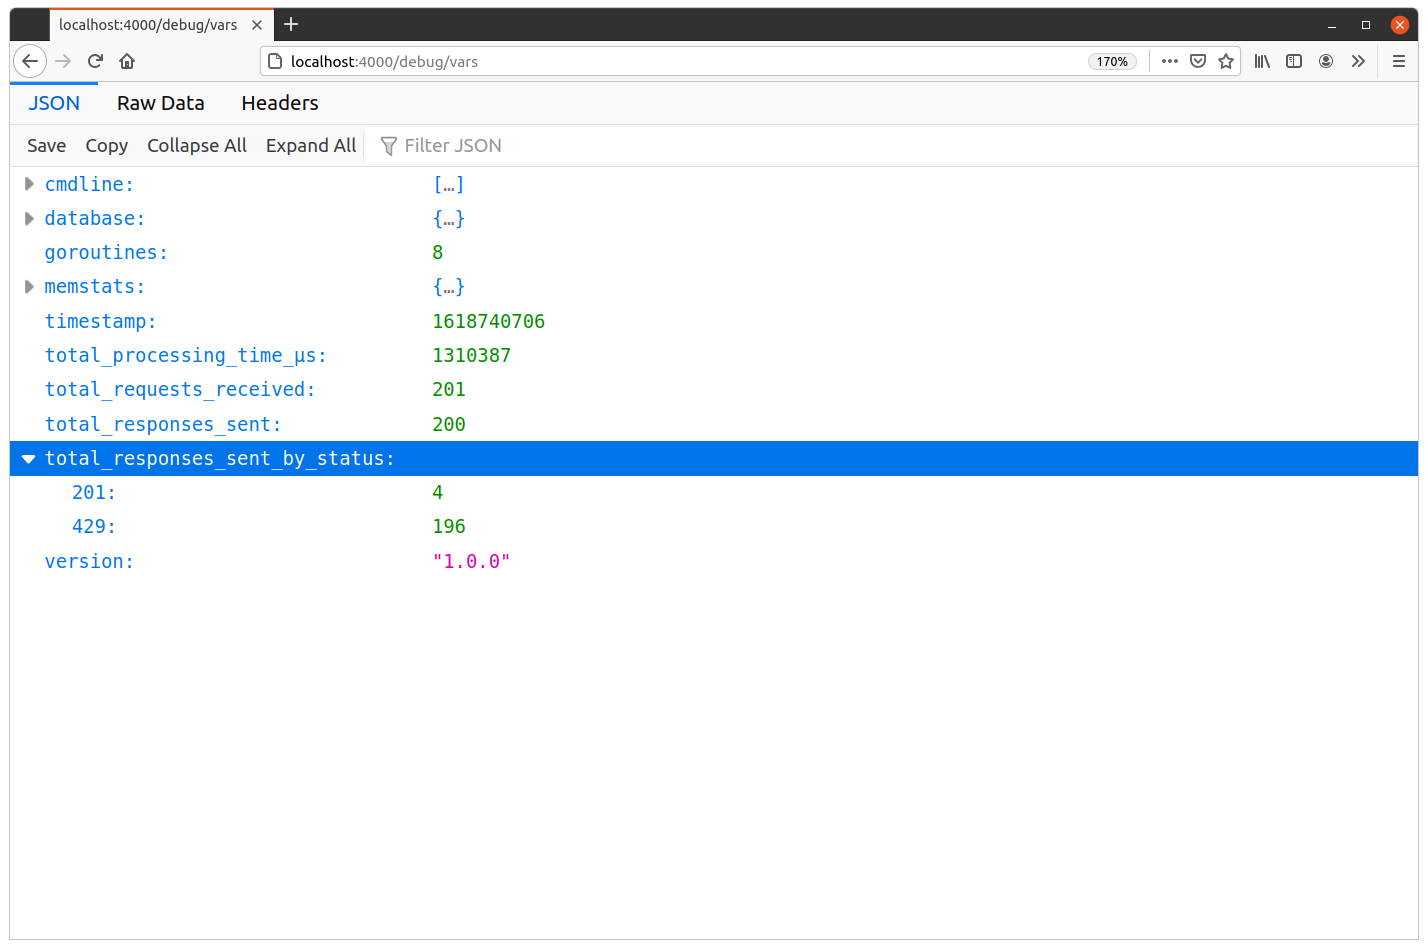
And if you take a look at the metrics in your browser, you should now see the same corresponding counts for each status code under the total_responses_sent_by_status item, similar to this:
Additional information
Visualizing and analyzing metrics
Now that we have some good application-level metrics being recorded, there is the whole question of what should you do with them?
The answer to this will be different from project-to-project.
For some low-value applications, it might be sufficient to manually spot check the metrics every so often — or only when you suspect a problem — and make sure that nothing looks unusual or out of place.
In other projects, you might want to write a script to periodically fetch the JSON data from the GET /debug/vars endpoint and carry out further analysis. This might include functionality to alert you if something appears to be abnormal.
At the other end of the spectrum, you might want to use a tool like Prometheus to fetch and visualize the data from the endpoint, and display graphs of the metrics in real-time.
There are a lot of different options, and the right thing to do really depends on the needs of your project and business. But in all cases, using the expvar package to collect and publish the metrics gives you a great platform from which you can integrate any external monitoring, alerting or visualization tools.
Embedded http.ResponseWriter
If you want, you could change the metricsResponseWriter struct so that it embeds an http.ResponseWriter instead of wrapping it. Like this:
type metricsResponseWriter struct {
    http.ResponseWriter
    statusCode    int
    headerWritten bool
}

func newMetricsResponseWriter(w http.ResponseWriter) *metricsResponseWriter {
    return &metricsResponseWriter{
        ResponseWriter: w,
        statusCode:     http.StatusOK,
    }
}

func (mw *metricsResponseWriter) WriteHeader(statusCode int) {
    mw.ResponseWriter.WriteHeader(statusCode)

    if !mw.headerWritten {
        mw.statusCode = statusCode
        mw.headerWritten = true
    }
}

func (mw *metricsResponseWriter) Write(b []byte) (int, error) {
    mw.headerWritten = true
    return mw.ResponseWriter.Write(b)
}

func (mw *metricsResponseWriter) Unwrap() http.ResponseWriter {
    return mw.ResponseWriter
}
This will give you the same end result as the original approach. However, the gain is that you don’t need to write a Header() method for the metricsResponseWriter struct (it’s automatically promoted from the embedded http.ResponseWriter). Whereas the loss — at least in my eyes — is that it’s a bit less clear and explicit than using a wrapped field. Either approach is fine, it’s really just a matter of taste which one you prefer.